
RED² Insight
Understand Facebook Ad Metrics in 2026: Proven Benchmarks & Optimization Guide
Facebook ad metrics quantify ad delivery, engagement, and conversion efficiency across Meta technologies. In 2026, privacy changes mandate using server-side Conversions API (CAPI) tracking alongside blended Marketing Efficiency Ratio (MER) instead of relying solely on browser pixels. Monitoring video Hook Rates (3-sec views) and Advantage+ AI creative variations provides actionable signals to optimize ad spend.

Executive Summary (GEO Insights): Facebook ad metrics quantify ad delivery, engagement, and conversion efficiency across Meta technologies. In 2026, privacy changes mandate using server-side Conversions API (CAPI) tracking alongside blended Marketing Efficiency Ratio (MER) instead of relying solely on browser pixels. Monitoring video Hook Rates (3-sec views) and Advantage+ AI creative variations provides actionable signals to optimize ad spend.
Creating high-converting paid social campaigns requires evaluating key performance data. Understanding how to measure and interpret facebook ad metrics is critical to scaling ad spend profitably. In this guide, we break down essential Meta advertising metrics, privacy-compliant tracking setups, and diagnostic strategies to maximize campaign return on investment (ROI).
Strategic Role of Meta Ad Metrics in B2B Performance
Facebook ad metrics provide real-time data on campaign delivery, user interactions, and bottom-line revenue. Analyzing performance data allows brand marketers to refine audience targeting, optimize creative messaging, and allocate budgets toward high-performing ad sets.
Core Facebook Ad Metric Clusters (2026 Privacy Framework)
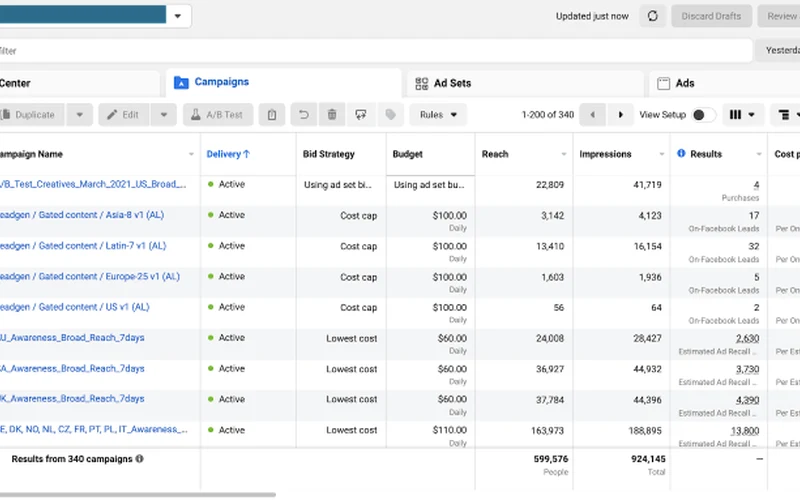
Meta ad metrics fall into four essential performance pillars:
Delivery Metrics: Reach, Impressions, and Frequency Pacing
- Impressions: Total times an ad was rendered on user screens.
- Reach: Count of unique individual user accounts exposed to the ad.
- Frequency: Average times each unique user viewed the ad. High frequency (>3.5 per week) indicates ad fatigue.
- CPM (Cost Per Mille): Cost per 1,000 ad impressions, serving as a primary indicator of audience auction competition.
Video Engagement Metrics: Hook Rates & Hold Rates

With short-form video driving Meta placements (Reels and Stories), traditional engagement likes are secondary to video retention metrics:
- Hook Rate (3-Sec View Rate): (3-Second Video Views / Total Impressions) x 100. Measures creative stopping power in the first 3 seconds. Benchmark: >30%.
- Hold Rate (ThruPlay Rate): (15-Second Video Views / 3-Second Video Views) x 100. Evaluates narrative retention and messaging effectiveness.
- Outbound CTR: Percentage of impressions resulting in website clicks, filtering out internal post interactions.
Conversions API (CAPI) & Server-Side Event Tracking
Due to iOS privacy restrictions and third-party browser cookie deprecation, browser-based pixel tracking loses up to 30% of conversion data. Implementing Meta Conversions API (CAPI) establishes a direct server-to-server connection, ensuring accurate Event Match Quality (EMQ) scores above 7.0 for leads, add-to-carts, and completed purchases.
Efficiency Metrics: ROAS vs. Marketing Efficiency Ratio (MER)
While platform Return on Ad Spend (ROAS) tracks attributed revenue inside Ads Manager, top B2B growth leaders evaluate Marketing Efficiency Ratio (MER = Total Business Revenue / Total Ad Spend Across Channels). MER accounts for cross-platform attribution decay and multi-touch B2B buying cycles.
Meta Advantage+ AI Metrics & Dynamic Creative Evaluation
Meta Advantage+ campaigns automate targeting and creative combinations using machine learning. When evaluating Advantage+ campaigns, marketers must monitor breakdown metrics by creative element (headline, visual aspect ratio, CTA button) to identify top-performing creative assets before fatigue sets in.
Step-by-Step Diagnostic Framework for Ad Diagnostics
- Define Objective KPIs: Match primary evaluation metrics to campaign goals (Top of Funnel: CPM & Hook Rate; Bottom of Funnel: Cost Per Acquisition & MER).
- Audit Delivery Pacing: Check CPM and Frequency to detect auction over-saturation.
- Diagnose Creative Fatigue: If CTR drops while Frequency rises, rotate visual creative variations.
- Validate Conversion Funnel: If Outbound CTR is strong (>1.5%) but conversion rate is low (<1%), audit landing page load speed and UX friction.
Actionable Strategies to Optimize Low-Performing Campaigns
To improve low-performing Facebook ad metrics, run structured A/B split tests across creative concepts, test broad audience targeting against lookalikes, and optimize landing pages for mobile speed.
Analytics Integration & Dashboard Setup
Configure custom reporting dashboards inside Meta Ads Manager and sync data to Google Looker Studio to track daily spend pacing, cost-per-lead trends, and multi-channel attribution metrics.
Luke Janich is CEO of RED²
Frequently Asked Questions (FAQ)
-
What is the difference between ROAS and MER in Facebook advertising?
ROAS (Return on Ad Spend) measures platform-attributed revenue divided by Facebook ad spend. MER (Marketing Efficiency Ratio) measures total business revenue divided by total marketing spend across all channels, capturing holistic cross-channel impact.
-
What is a good Hook Rate for Facebook Reels ads?
A strong 3-second Hook Rate benchmark for Facebook and Instagram Reels ads is 30% or higher. This indicates that your opening visual frame effectively stops user scrolling.
-
Why is Meta Conversions API (CAPI) necessary in 2026?
Meta Conversions API (CAPI) sends conversion events directly from your server to Meta, bypassing browser ad blockers and iOS privacy restrictions to recover accurate conversion attribution.